
MLFlow on Google Cloud Platform
Published:
Running mlflow on Google Compute Engine VM and logging artifacts on Google Storage Bucket
In a process of tuning an ML model, it is important to keep track of the results of experiments, hyperparameters and trained models. MLflow, developed by Databricks, is a platform that allows us to conveniently store these things and share the progress with your collaborators. The framework introduces 3 distinct features each with its own capabilities:
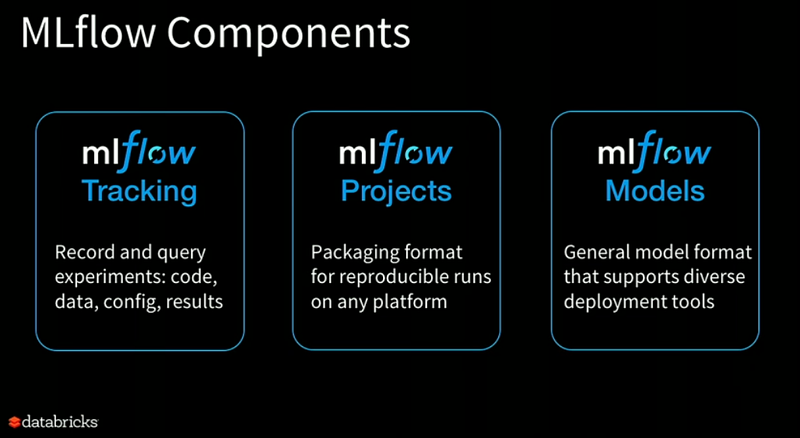
- MLflow Tracking: Tracking is maybe the most interesting feature of the framework. It allows you to create an extensive logging framework around your model. This component allows you to log codes, custom metrics, data files, config, and results. It also allows querying your experiments through which you visualize and compare your experiments and parameters swiftly without much hassle. We will mainly focus on this component in this article
- MLflow Projects: It provides a structured format for packaging machine learning codes along with useful API and CLI tools. This feature uses its own template to define how you want to run the model on a cloud environment
- MLflow Models: It is a standard format for packaging and distributing machine learning models across different downstream tools — for example, real-time serving through a REST API or batch inference on Apache Spark.
In this post, I will show how to deploy an MLflow tracking server on Google Cloud Platform (Compute Engine) and log artifacts/models on the storage bucket. It will be able to store hyperparameters, metrics, trained models and any other artifacts in the cloud.
Reasons to use MLFlow
- Easy collaboration in a remote or local environment for individuals or teams.
- Simplified tracking for ML models means faster time to insights and value.
- Launch of model registry enhances governance and core proposition of model management.
- No native support for feature engineering, data pipeline development, and pipeline orchestration, meaning it requires other components.
- Essentials for hosting available and easy ability to push to cloud vendor API endpoints.
- Enables quick development of foundational ProductionML pattern with Databricks obviously or established cloud components.
Each run records the following information:
- Code Version: Git commit used to execute the run if it was executed from an MLflow Project.
- Start & End: Start Time and end time of the run
- Source: Name of the file executed to launch the run, or the project name and entry point for the run if the run was executed from an MLflow Project.
- Parameters: Key-value input parameters of your choice. Both keys and values are strings.
- Metrics: Key-value metrics where the value is numeric. Each metric can be updated throughout the course of the run, and MLflow will record and let you visualize the metric’s full history.
- Artifacts: Output files in any format. For example, you can record images, models or even data files as artifacts.
1. Steps to run mlflow on Google Compute Engine
Follow these steps to set up the mlflow server on Compute Engine:
Step 1: Create VM instance based on Ubuntu Linux 18.04 LTS Installing mlflow
Step 2: Install mlflow on VM — SSH your VM either from the console or Putty and run the following commands to install mlflow
Commands executed on the shell
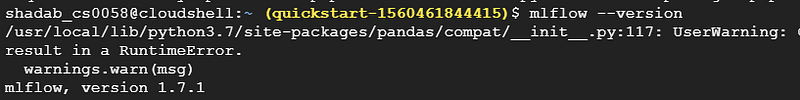 Checking mlflow version
Step 3: Run mlflow server on internal IP of VM instance (default 127.0.0.1)
Check internal IP using the command ifconfig . Its output will look like this:
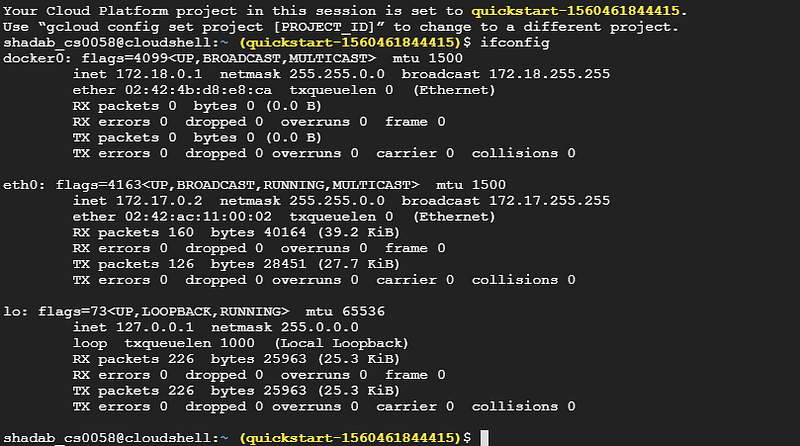 Check for Internal IP using `ifconfig`
As you can see 172.18.x.x is the internal IP. Run mlflow server using this command: mlflow server --host 172.18.x.x (Use your internal IP in the place of 172.18.x.x):
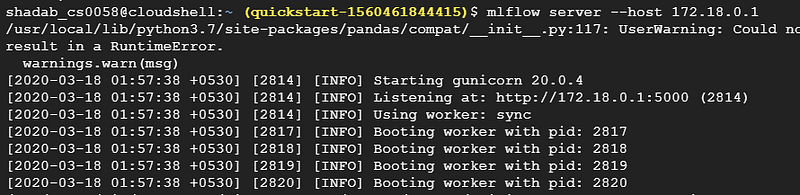 Start mlflow server on Internal IP
Step 4: Check from VM instance (from second connection) using curl -I [http://172.18.x.x:5000](http://172.18.x.x:5000) Checking Instance from Another Connection 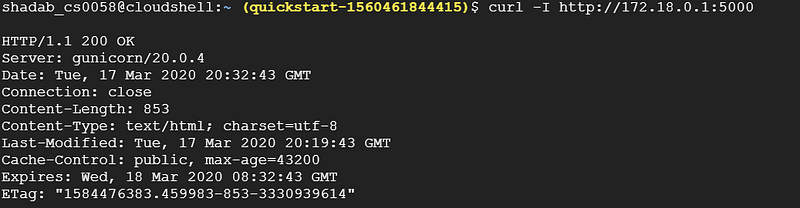
Step 5: Set Network Tag mlflow-server
Step 6: Create a Firewall Rule to allow access on port 5000 Firewall Rule to open Port 5000
Step 7: Check from on-premises Linux machine nmap -Pn 32.1.XXX.XXX
Starting Nmap 7.80 ( https://nmap.org ) at 2020-03-09 16:20 CETNmap scan report for x.x.x.x.bc.googleusercontent.com (32.1.XXX.XXX)Host is up (0.20s latency).Not shown: 993 filtered portsPORT STATE SERVICE...5000/tcp open upnp...
Step 8: Go to web browser http://x.x.x.x:5000/ (external IP)
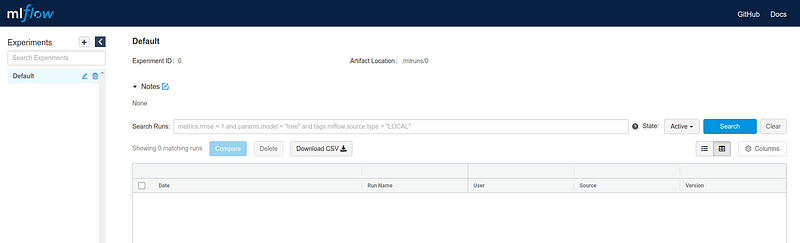
The MLflow Tracking component lets you log and query experiments using either REST or Python. You can close this mlflow server for now. Next, we need to configure the storage bucket to store our artifacts.
2. Steps to create Google Bucket for logging artifacts
Follow these steps to set up the storage bucket for logging models and artifacts:
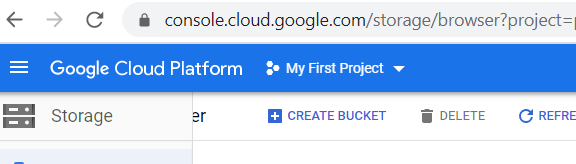
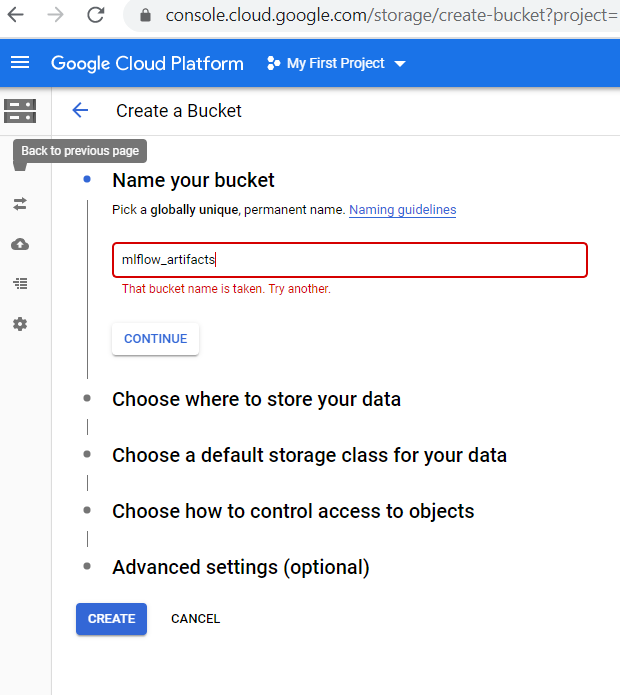
Step 1: Go to this link and click on Create Bucket:
Step 2: Give a name for your storage bucket, fill in other details and finally click on Create
Step 3: Once the bucket is created, open that and go to permissions :
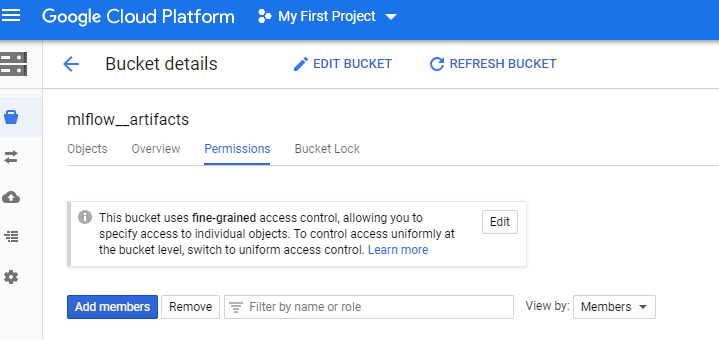
Here you need to either add a new member or use existing member if any and give him Storage Object Viewer and Storage Object Creator permissions.
Step 4: Get the bucket path which will be of the form- gs://<bucket>/<path> . For any help visit this link.
Step 5: Finally, run this command on both client and server to access Google Cloud Storage- pip install google-cloud-storage
Step 6: Start the MLflow tracking server by giving bucket path as default artifact directory and use internal IP to spin off the run server. It will use port 5000 by default: Run mlflow server
Step 7: Now we can access your server using its public IP http://x.x.x.x:5000/
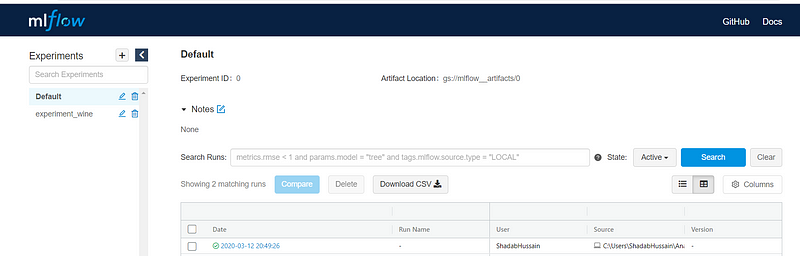
As you can observe, Artifact Location has been set to the storage bucket path now.
3. Steps to authenticate Google account and Run Experiments
Step 1: Authenticate account to log artifacts on storage bucket
- Get the service account json
Set the following environment variable in your notebook, or you can set it from your shell also Service Account Credentials Setup
- Run this code for authentication: Client Authentication
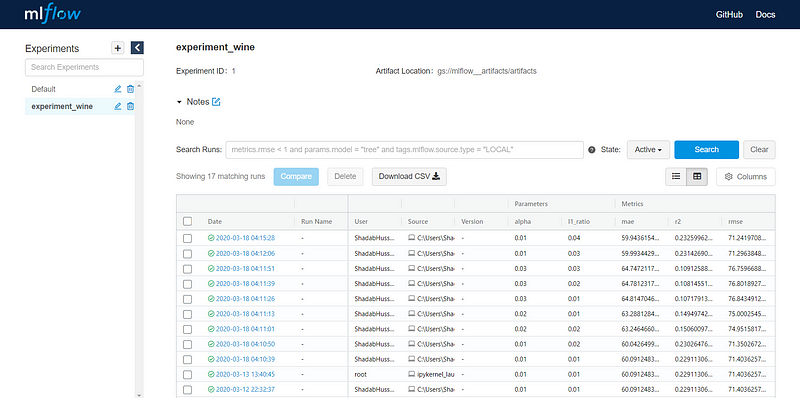
Step 2: Run this code with different values of alpha and l1_ratio & log metrics, parameters, and artifacts. Also, in mlflow.set_tracking_uri("http://x.x.x.x:5000") replace x.x.x.x with your external IP in the code: If you will go to external IP (Public DNS), you can see different versions of the model you have run:
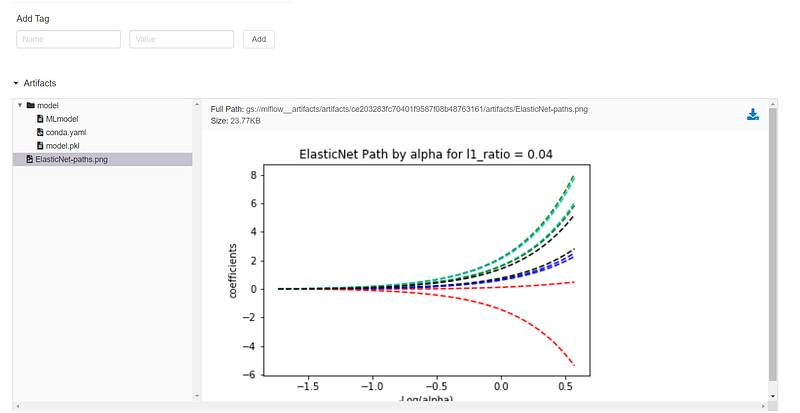
You can click on any of the models and check for the artifacts/models logged:
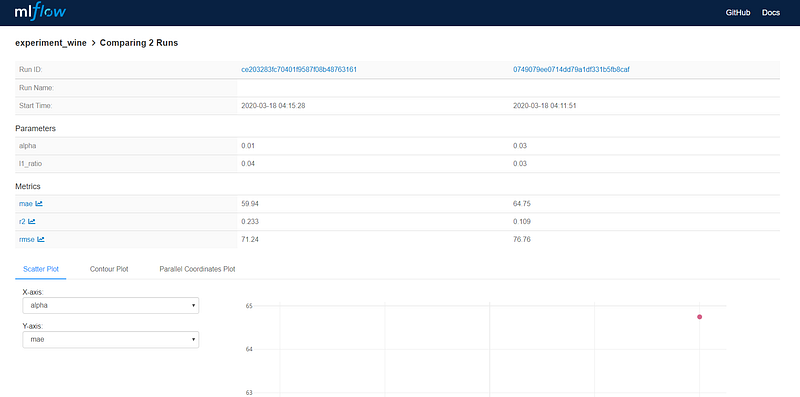
Also, you can select any of the models and compare them with each other.
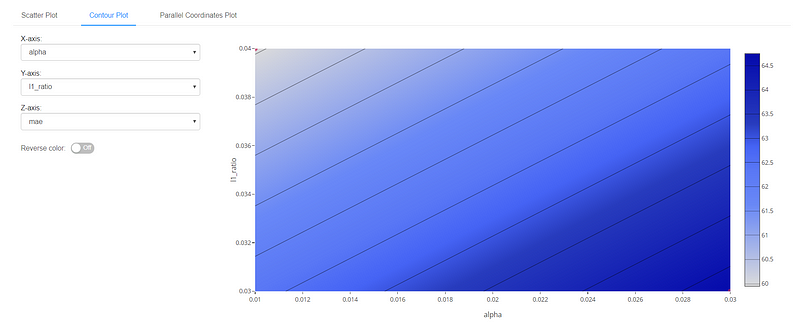
There is a lot more you can do with it, like contour plot for alpha, l1_ratio, and mae:
So, here onwards you can experiment on your own and share your findings in the comment.
By Shadab Hussain on March 18, 2020.